Average handle time (AHT) is the average duration of one interaction, calculated as total talk time plus total hold time plus total after-call work, divided by the total number of calls. In US healthcare call centers it commonly runs 3 to 4 minutes for simple scheduling and 6 to 8 minutes for complex eligibility or billing calls. Tracking AHT without understanding what drives it is like checking a patient's temperature without diagnosing the fever, so the real work begins when you break the number down and see where your minutes are going.
This guide covers the formula, healthcare benchmarks, and five steps to reduce AHT without rushing patients off the phone.
What Is Average Handle Time? The Formula
Average handle time (AHT) measures how long agents spend resolving one interaction, from call connection to completed post-call work.
The average handle time formula:
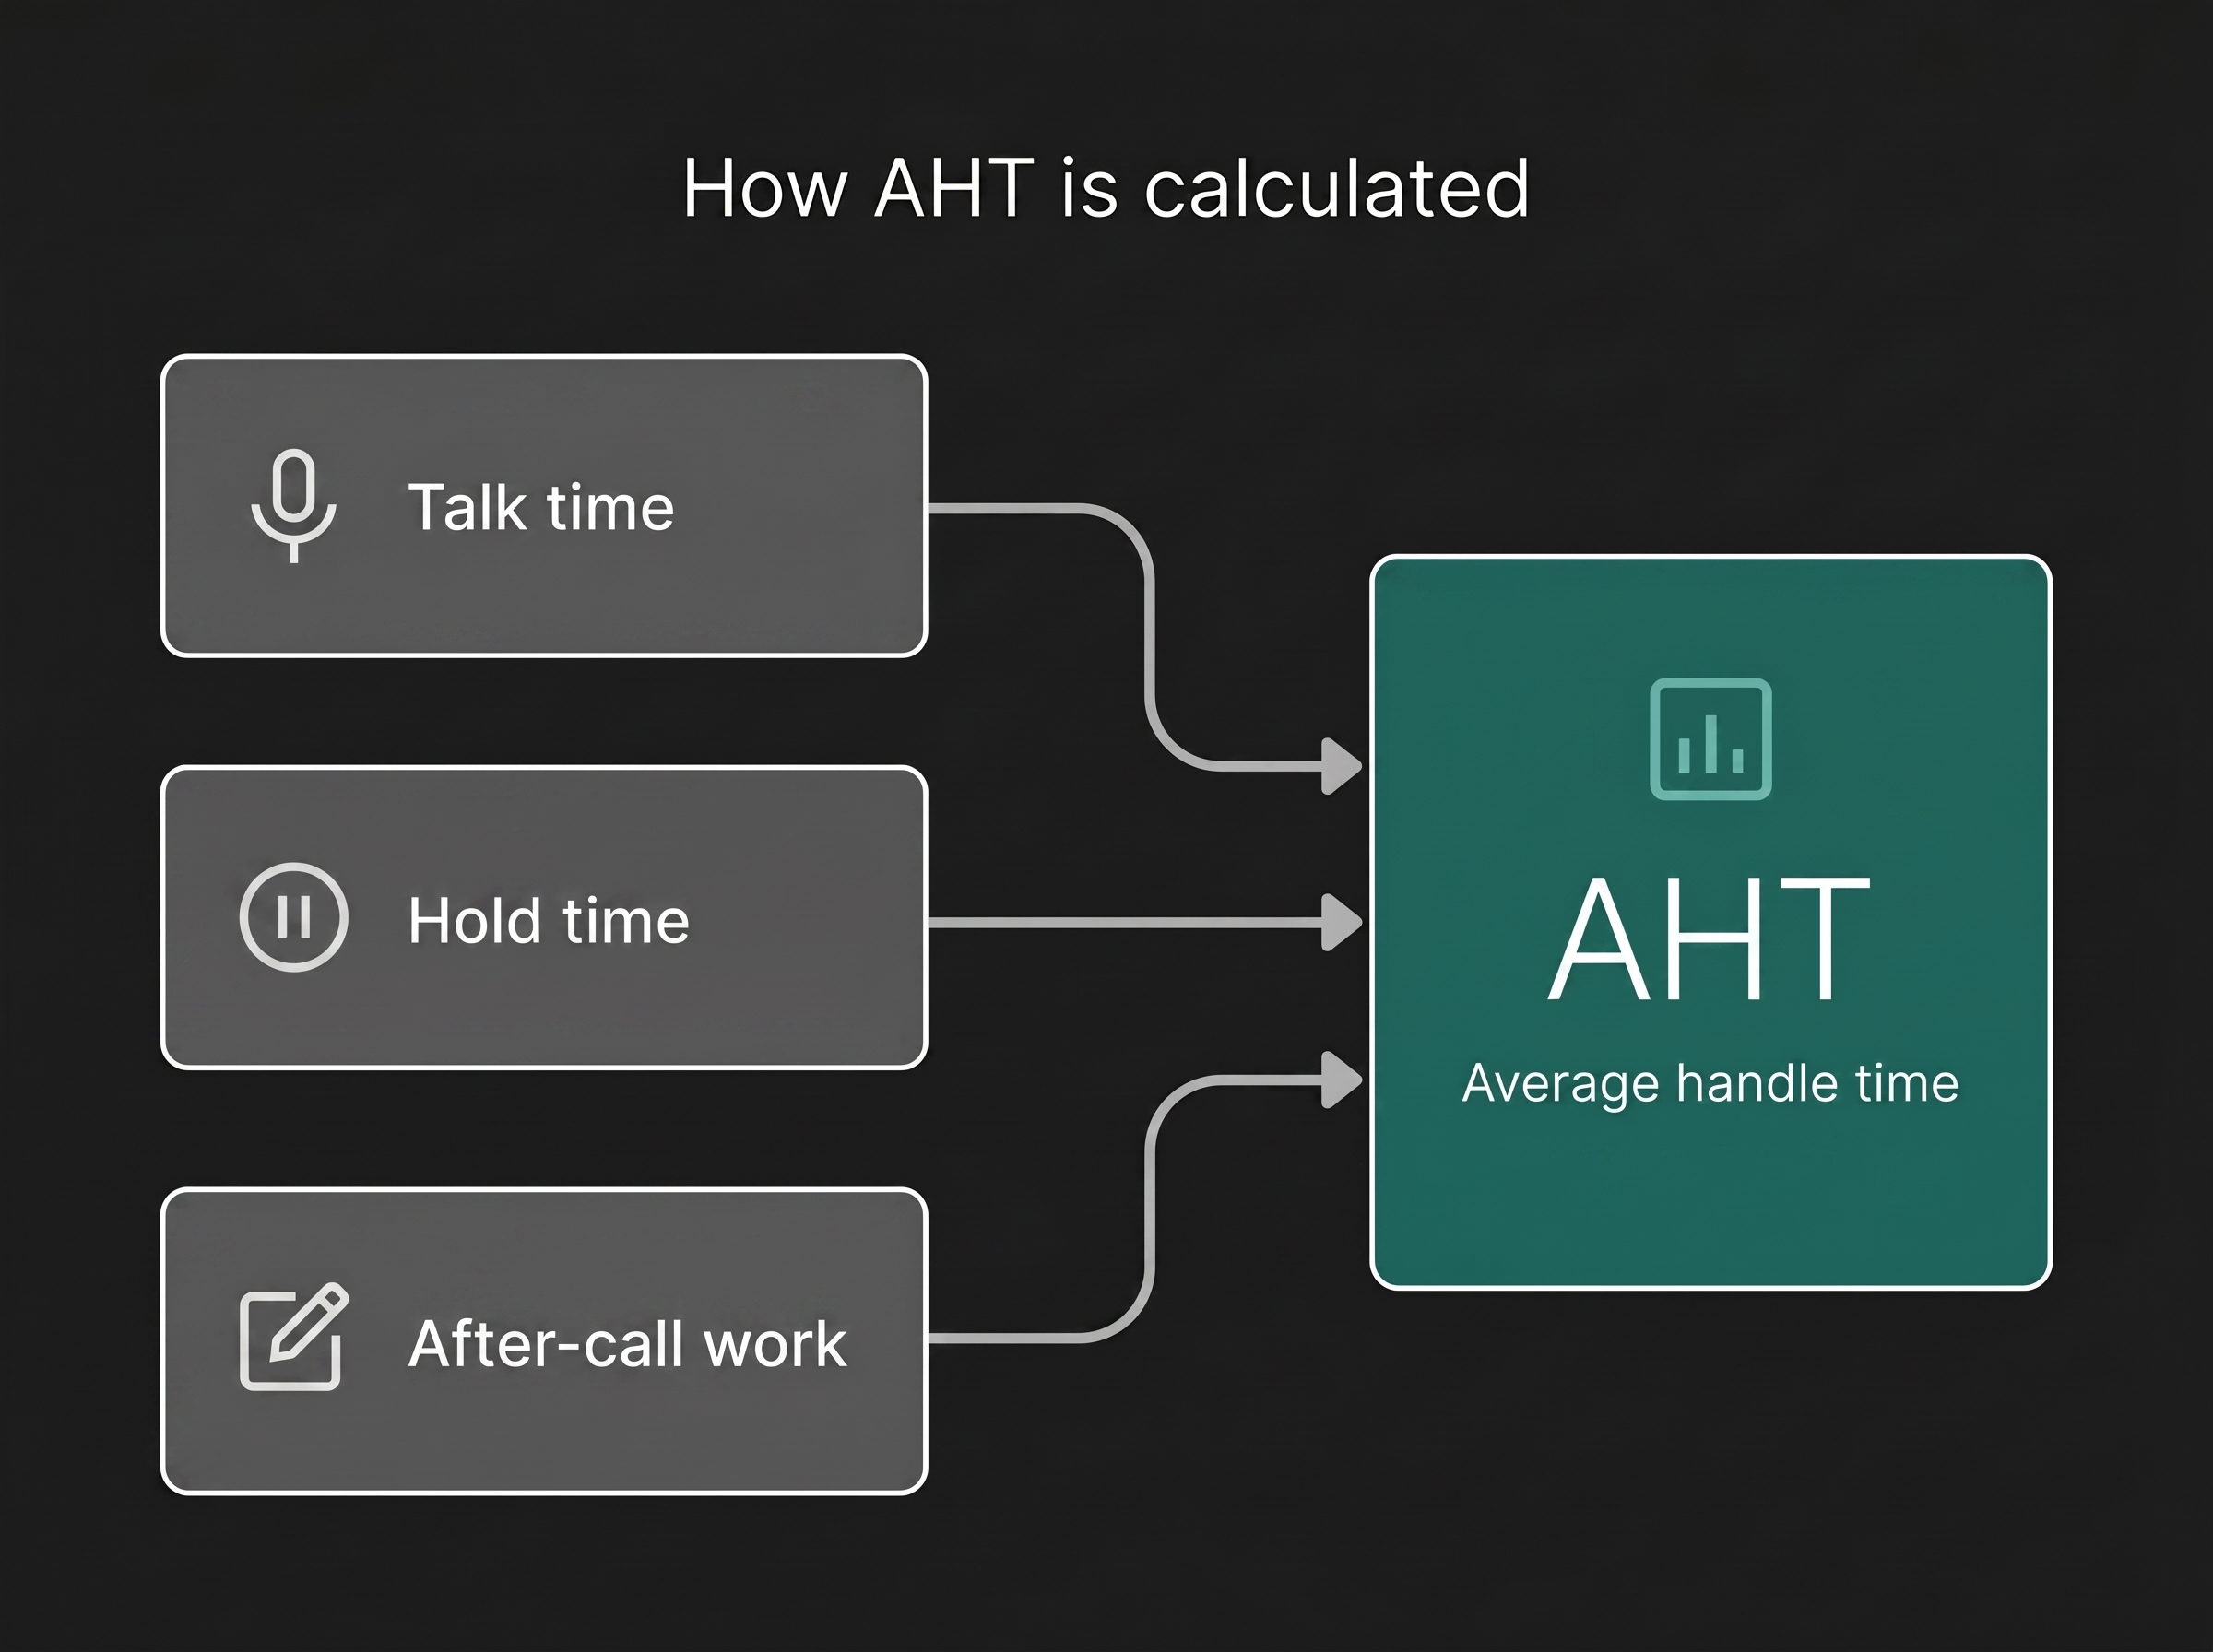
AHT = (Total Talk Time + Total Hold Time + Total After-Call Work) / Total Number of Calls
Each component plays a distinct role:
- Talk time is the duration an agent spends speaking with the caller, including any time spent entering data while on the line.
- Hold time is any period the caller waits while the agent looks up information, verifies insurance, or consults a colleague.
- After-call work (ACW) covers everything the agent does once the caller hangs up: updating the EHR, logging notes, sending referral requests, or entering disposition codes.
Calculation Example
Say your team of 12 agents handled 400 calls last week. Across those calls, they logged 1,600 minutes of talk time, 400 minutes of hold time, and 200 minutes of after-call work.
AHT = (1,600 + 400 + 200) / 400 = 5.5 minutes
That 5.5-minute average tells you where you stand. But to take action, you need to know what "good" looks like.
Why AHT Is One of the Most Important Call Center KPIs
AHT sits at the intersection of cost, capacity, and experience. Here is why it shows up on nearly every list of call center KPIs:
Staffing and capacity. When you know your average handle time, you can forecast how many agents you need per shift. A Cornell University study found cross-industry AHT averages around 6.46 minutes, but the number varies widely by sector.
Operational costs. Reducing AHT by even 10 to 15 seconds per call compounds across thousands of monthly interactions. For a 50-agent center handling 2,000 calls per day, a 15-second reduction can recover hundreds of agent-hours per month.
Patient experience. In healthcare, long hold times correlate directly with lower patient satisfaction scores. The average U.S. healthcare hold time is 4.4 minutes, far above the HFMA's 50-second target.
AHT Benchmarks by Industry
Sources: Nextiva, Sobot, CloudTalk
The range within healthcare is wide because a scheduling call and an insurance eligibility call are very different tasks. That is why Step 1 matters.
Step 1: Audit Your Current AHT by Call Type
A single AHT average hides more than it reveals. Start by segmenting calls into categories:
- Appointment scheduling (typically 2 to 4 minutes)
- Insurance eligibility and verification (often 5 to 10+ minutes, depending on hold times with payers)
- Billing inquiries (4 to 7 minutes)
- Clinical triage or nurse line (8 to 15 minutes)
- Prescription refill requests (2 to 4 minutes)
Once segmented, you will likely find that one or two call types drive a large share of total handle time. Eligibility verification, for example, often involves payer hold times that training alone cannot fix.
Action: Pull AHT data from the past 90 days by call type. Rank each category by volume and average duration. Start with the highest-volume, highest-AHT category.
Step 2: Reduce Hold Time with Better Routing and Access
Hold time is the most frustrating component for callers and the easiest to overlook in aggregate data. Two strategies help:
Skills-based routing. Route eligibility calls to agents trained on payer portals such as Availity, or better, replace the manual lookup with a 270/271 eligibility transaction. Route scheduling calls to agents with practice management system access. When callers reach the right person on the first transfer, hold time drops and so does first call resolution failure.
System access improvements. If agents spend minutes switching between applications, that is not a training problem. It is a workflow problem. Unified dashboards that show patient data, insurance status, and scheduling availability reduce hold time at the source.
In healthcare specifically, hold times above 20 minutes are not uncommon for complex eligibility or authorization calls. Prior authorization is a large part of that burden: physicians and their staff spend an average of 13 hours a week on it, per AMA survey data. Reducing these outliers has an outsized effect on your overall AHT.
See where an AI agent fits in your operation.
Book a demoStep 3: Streamline After-Call Work
After-call work is the hidden driver of AHT that many teams underestimate. In healthcare call centers, ACW includes:
- Updating patient records in the EHR (Epic, athenahealth, and similar systems)
- Logging call disposition codes
- Sending referral or authorization requests
- Noting insurance details or callback requirements
All of this touches protected health information, so the tooling that automates it has to stay inside a HIPAA-compliant boundary.
When ACW runs long, it creates a chain reaction: agents are unavailable for the next call, queue times rise, and the next caller's experience suffers.
Practical fixes:
- Auto-populated disposition fields: Pre-fill common fields based on call type so agents confirm rather than type from scratch.
- Call summarization: AI-generated call summaries can cut documentation time by giving agents a draft to review and approve rather than writing from memory.
- Standardized templates: Create EHR note templates for each call type. A scheduling note should not require the same documentation as a billing dispute.
Step 4: Train Agents on Call Control Techniques
Call control does not mean rushing. It means guiding the conversation efficiently so both the agent and the caller stay on track.
- Structured call openings: Agents who confirm name, date of birth, and reason for calling in the first 15 seconds set up a focused interaction.
- Active listening with direction: Acknowledge the caller’s concern, then guide the call forward. For example: “I understand you have a billing question. Let me pull up your account so we can review it together."
- Buddy pairing: Pair agents with high AHT alongside agents who consistently resolve calls quickly. Real-time observation and coaching transfer practical habits faster than classroom training alone.
- Ongoing calibration: Track individual AHT alongside CSAT and FCR. Low AHT with high repeat-call rates is not efficiency. It is pushing the problem to the next interaction.
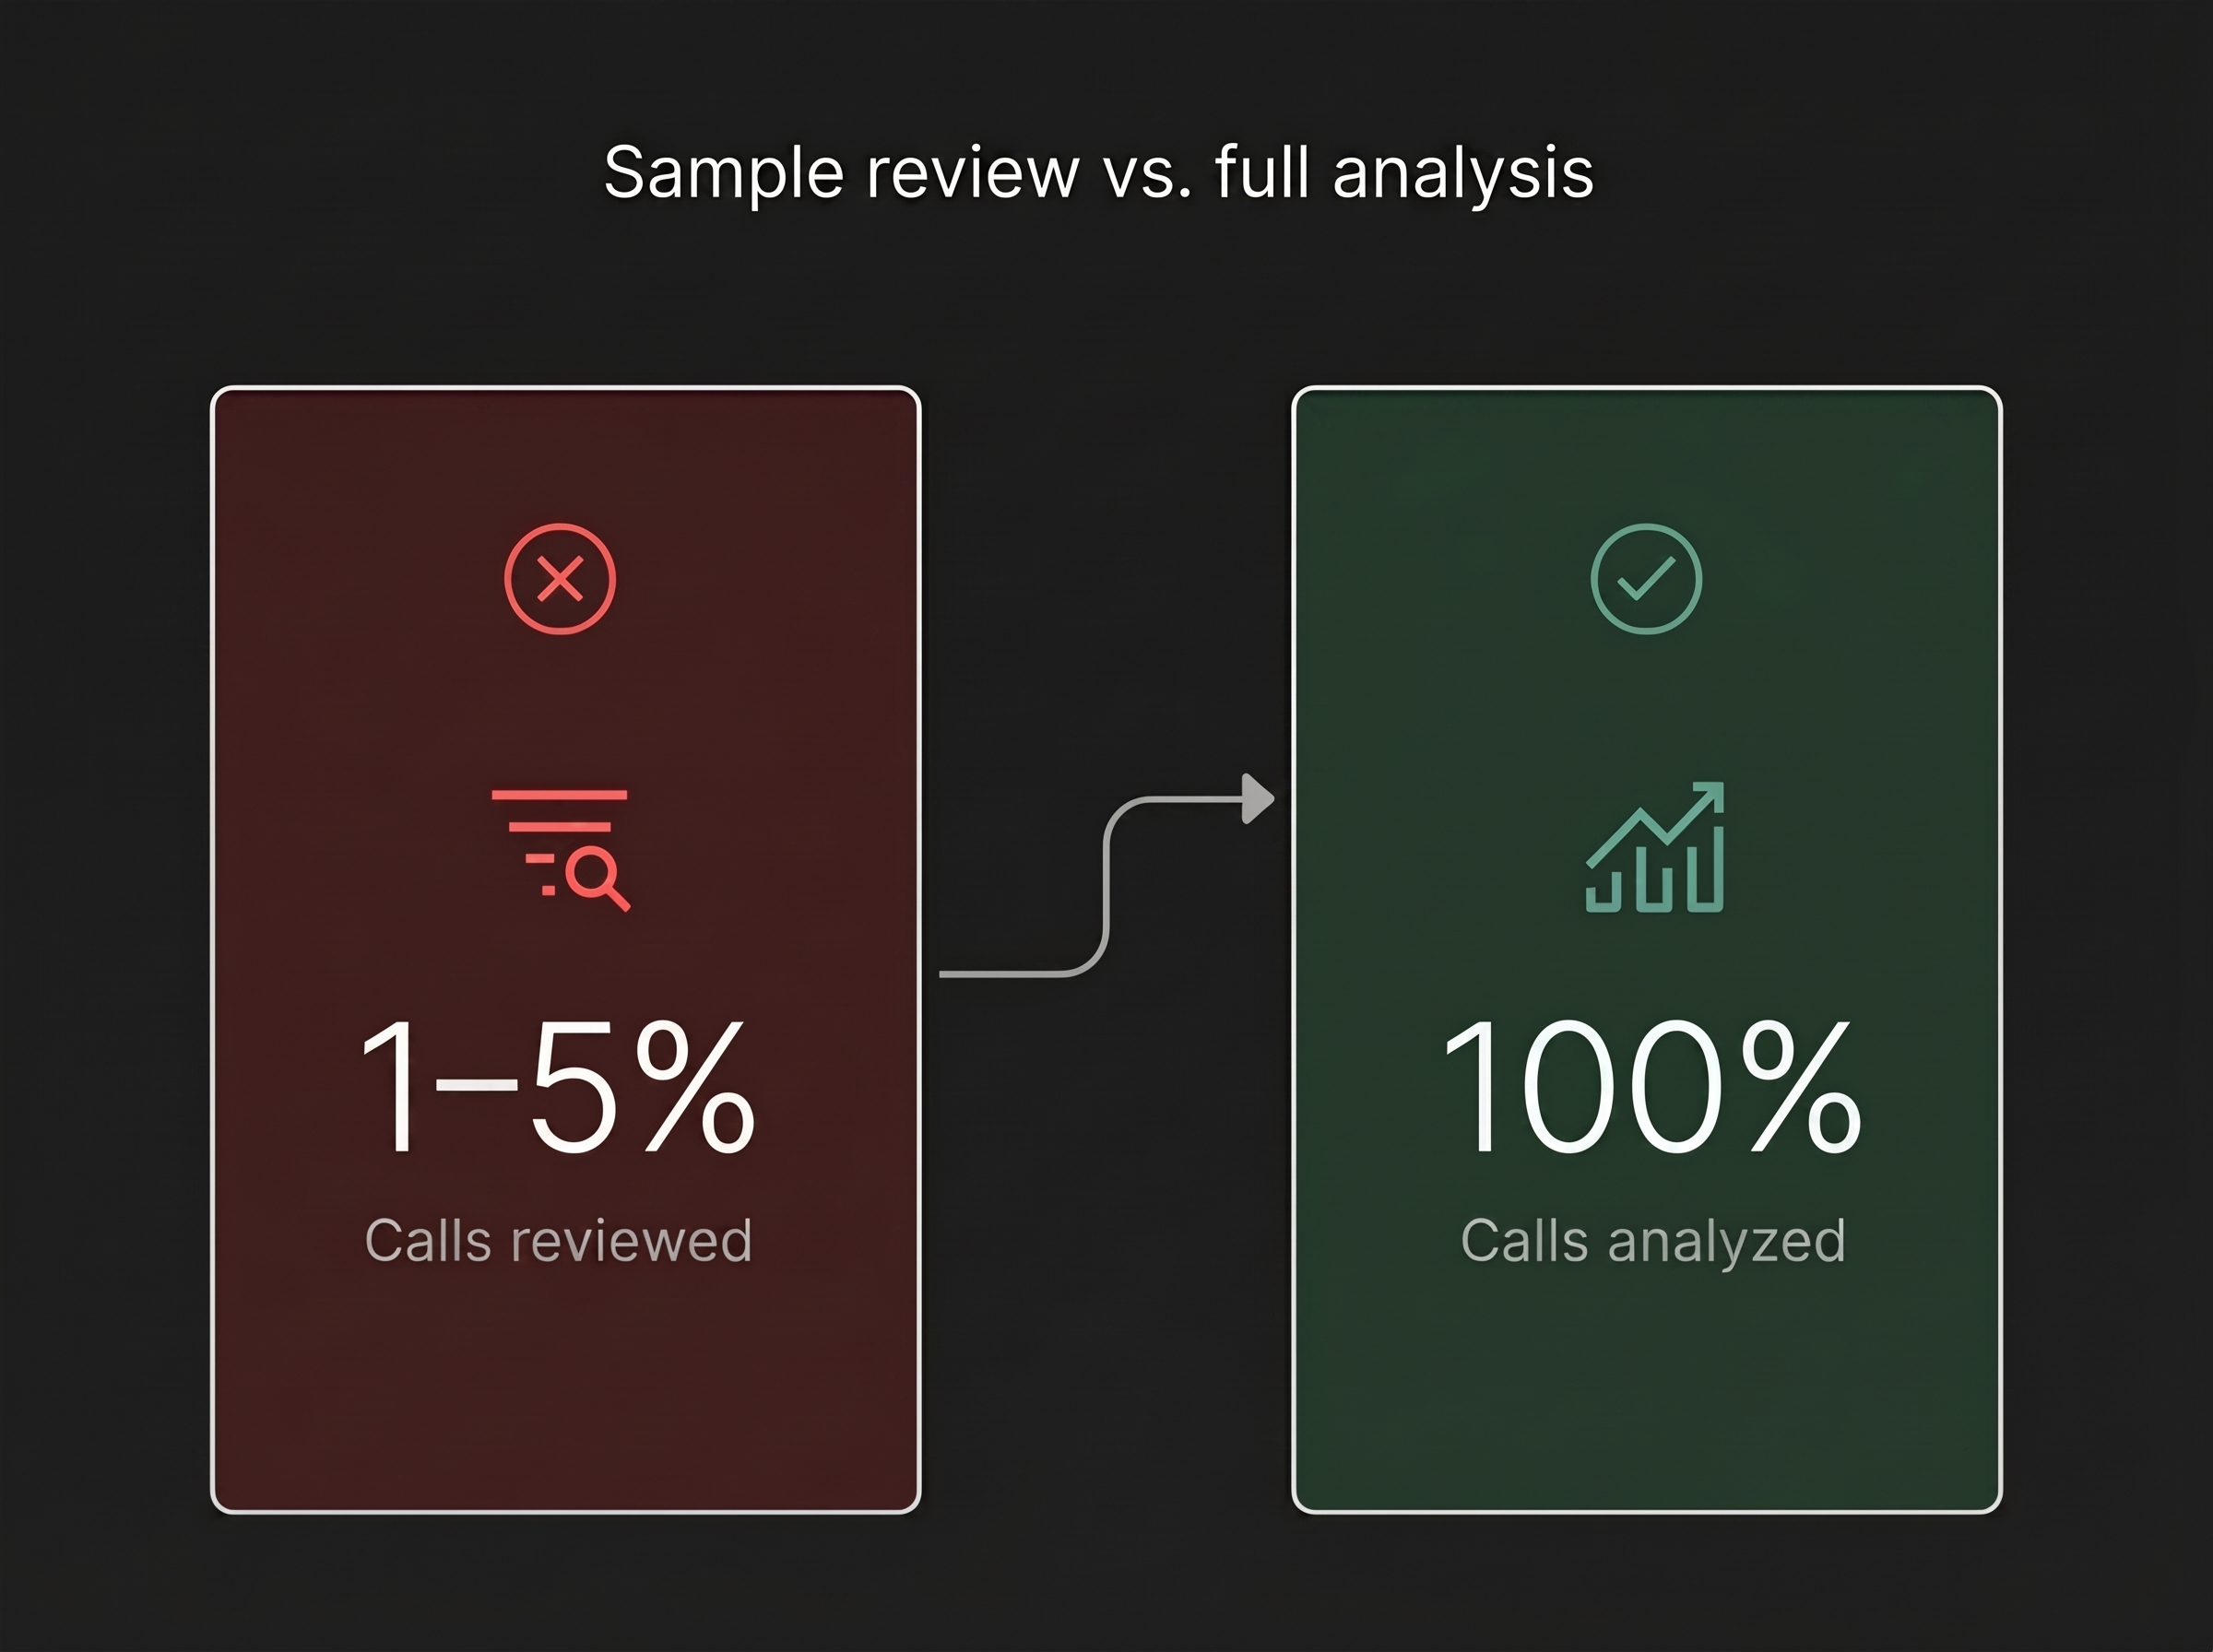
Step 5: Analyze All Calls, Not Just a Sample
Most call centers review 1 to 5 percent of calls for quality assurance. That sample size can identify individual coaching moments, but it cannot reveal the systemic patterns that inflate AHT across your entire operation.
When you analyze 100% of calls, you can identify:
- Which IVR paths lead to the longest handle times
- Which payer hold times are spiking on specific days
- Which call types have the widest AHT variance between agents
- Where after-call work consistently exceeds benchmarks
Full-interaction analysis turns AHT from a lagging metric into a diagnostic tool. Instead of reacting to last month’s numbers, you can spot root causes in real time.
Troubleshooting Common AHT Problems
AHT is dropping but CSAT is dropping too. Agents may be rushing calls to hit targets. Review your scorecard. If AHT is weighted too heavily over satisfaction and first call resolution, agents may prioritize speed over quality.
AHT is high on one call type only. This usually points to a process or system bottleneck, not an agent skill gap. Check payer hold times, EHR load times, or missing information that causes follow-up calls.
New hire AHT is spiking the team average. This is normal. Track new hires on a separate ramp curve, usually 60 to 90 days, and use early calls for coaching instead of penalizing the team average.
Your AHT Reduction Roadmap
Use this five-point checklist to systematically bring down average handle time without sacrificing call quality:
- Segment AHT by call type: Identify your highest-volume, highest-AHT category and target it first.
- Map hold time causes: Separate hold time driven by payer wait times from hold time caused by internal system access issues.
- Audit after-call work: Time how long ACW takes per call type and identify documentation steps that can be automated or templated.
- Implement call control training: Focus on structured openings, active redirection, and buddy pairing for high-AHT agents.
Move to full-call analysis: Analyze 100% of interactions to find systemic patterns that sample-based quality assurance reviews miss.
Each step builds on the last. Start with data, fix the process, train the team, and verify results through comprehensive analysis. That is how you turn the average handle time formula from a number on a dashboard into a lever for healthcare call center optimization.