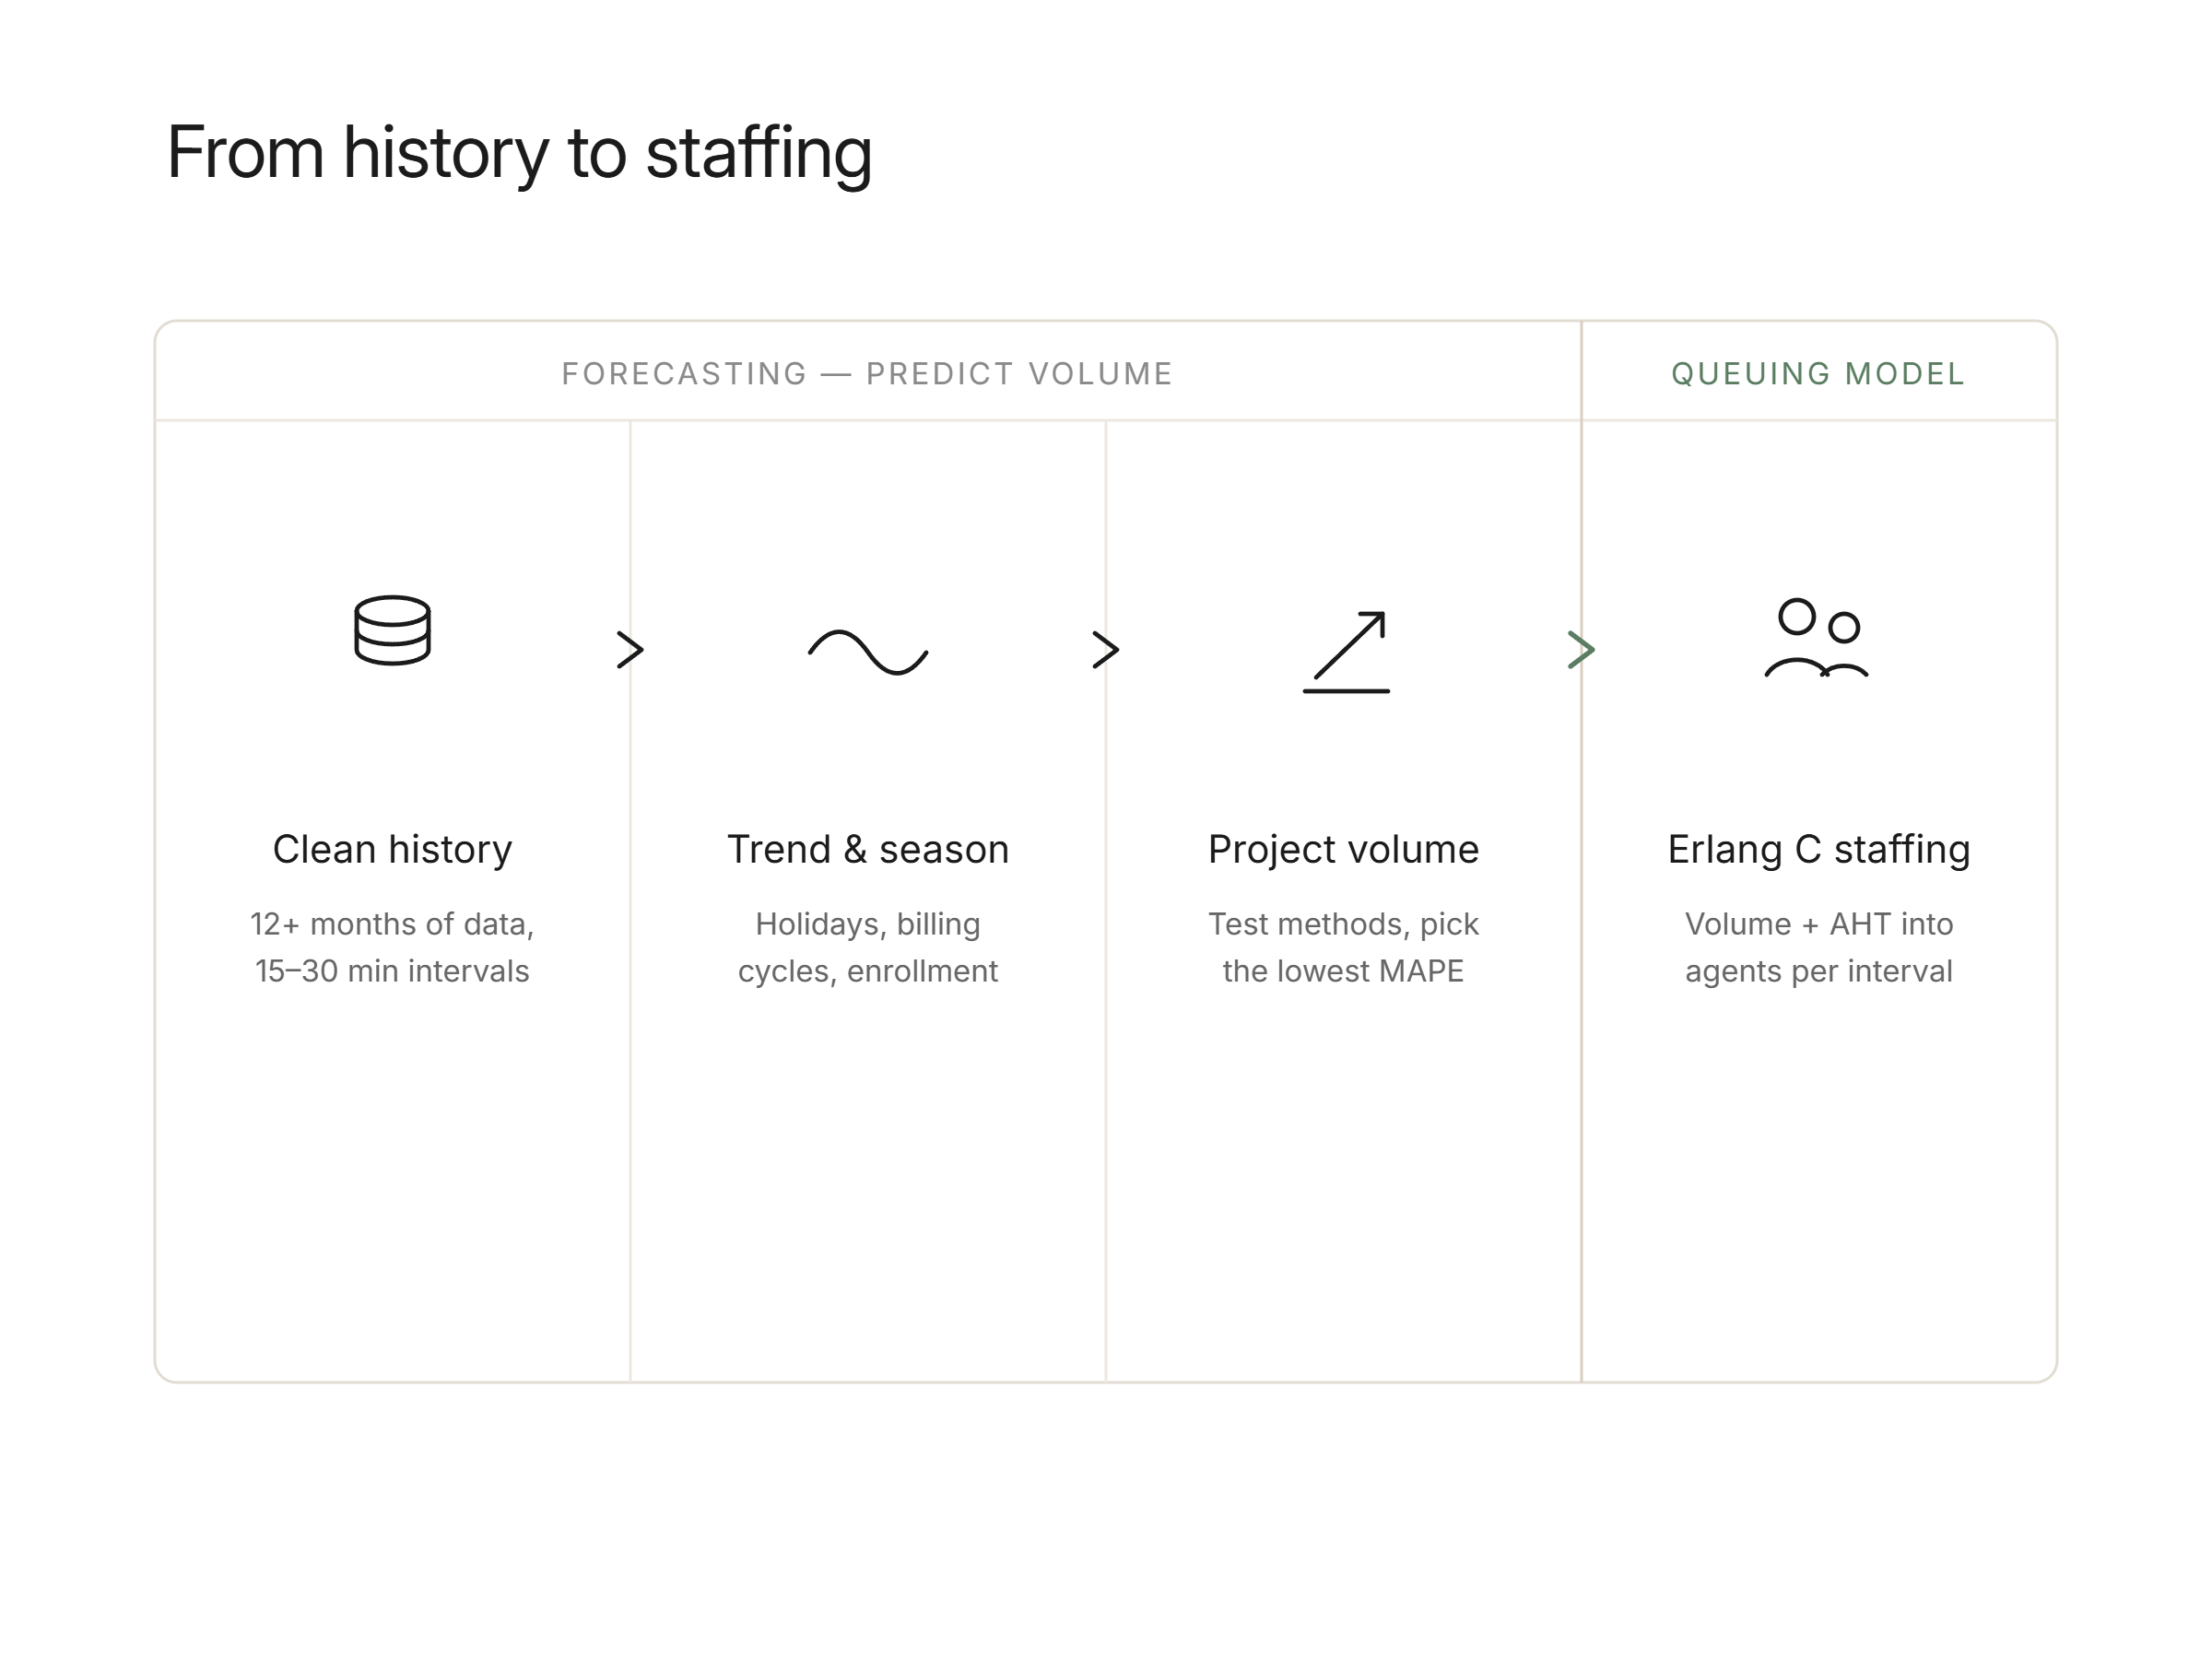
Call volume forecasting predicts how many contacts a center will receive over a future period, broken into intervals, so you can staff to meet service levels. The standard approach starts with historical data: pull past volume by day and by interval, adjust for seasonality and known events, project the trend forward, then use a queuing model such as Erlang C to translate predicted volume and average handle time into the number of agents needed. Accuracy is usually measured with Mean Absolute Percentage Error (MAPE). According to Calabrio, the widely cited industry benchmark for forecast accuracy is plus or minus 5 percent for larger centers. The sections below cover how to forecast, which methods are most accurate, how to measure accuracy, and how automation reduces the cost of a miss.
How do you forecast call volume?
Forecasting call volume is a sequence of steps, not a single calculation. Start with clean historical data, ideally 12 or more months of contact volume broken down to 15 or 30-minute intervals so you capture daily and weekly patterns. Identify the trend (is volume growing or shrinking?), the seasonality (holidays, enrollment periods, billing cycles), and any one-off spikes you should exclude or flag.
According to Calabrio, the three core inputs most centers forecast are contact volume, average handle time, and the daily arrival pattern. Once you have a volume forecast, a queuing model such as Erlang C converts it, together with your handle time and service-level target, into required staffing per interval. The forecast is only as good as the history behind it, so cleaning outliers and tagging known events matters more than the specific technique you choose.
Want this mapped against your own call and claim volume? Book a 30-minute audit
Which forecasting methods are most accurate?
No single method wins for every center, because the best choice depends on your data volume and how stable your patterns are. According to Call Criteria, commonly used techniques include triple exponential smoothing (Holt-Winters), ARIMA, and neural networks, each suited to different pattern types. Holt-Winters handles clear trend-and-seasonality data well. ARIMA fits time series with more complex autocorrelation. Neural networks can capture nonlinear patterns when you have a large, rich history.
A forecast by call type is more useful than a forecast of total volume, because the types behave differently and only some of them can be automated. Flexbone classifies recorded calls into those types, which gives the forecast inputs a center rarely has on hand. See contact center automation.
It helps to separate two things that often get conflated. Forecasting methods predict how many contacts will arrive. Erlang C and Erlang A are queuing models, not forecasting methods: they translate a volume forecast into staffing. In practice, mature teams test more than one forecasting method against held-out history and pick the one with the lowest error for their data, rather than committing to a single technique in the abstract.
See what AI can run at your facility. In a 30-minute audit we map the calls, eligibility, and follow-ups Flexbone can take off your team first.
Book an auditHow do you measure forecast accuracy?
Forecast accuracy is usually measured with Mean Absolute Percentage Error (MAPE). For each interval, take the absolute difference between forecast and actual, divide by actual to get a percentage error, then average those percentages across the day or week. Lower MAPE means a tighter forecast.
According to OpsDog, the target depends on center size because small centers have noisier patterns. Large agent groups of roughly 100 or more should aim for within plus or minus 5 percent at the interval level, while smaller groups of 15 or fewer agents realistically target plus or minus 10 percent. Averaging error at the interval level, rather than only comparing daily totals, matters: a daily total can look accurate while individual intervals swing wildly, which is exactly where staffing breaks down and holds pile up.
How does automation help with peaks?
Even a good forecast misses. A local news story, a payer system outage, or a snow day can push volume well past what any model predicted, and that gap is where service levels collapse and hold times spike. Traditional responses (overtime, voluntary time off, borrowing agents from other skills) are slow and expensive to spin up mid-spike.
This is where automation changes the economics of a forecast miss. According to Qualtrics, routing appropriate inquiries to self-service and automated channels reduces the load that reaches live agents. When an AI agent can absorb the routine overflow during a peak (status checks, simple eligibility questions, form intake), a forecast that runs 15 percent light no longer means 15 percent of callers wait on hold. The cost of underforecasting drops, because the automated layer flexes instantly while your human staffing plan catches up.
How Flexbone helps you handle peaks
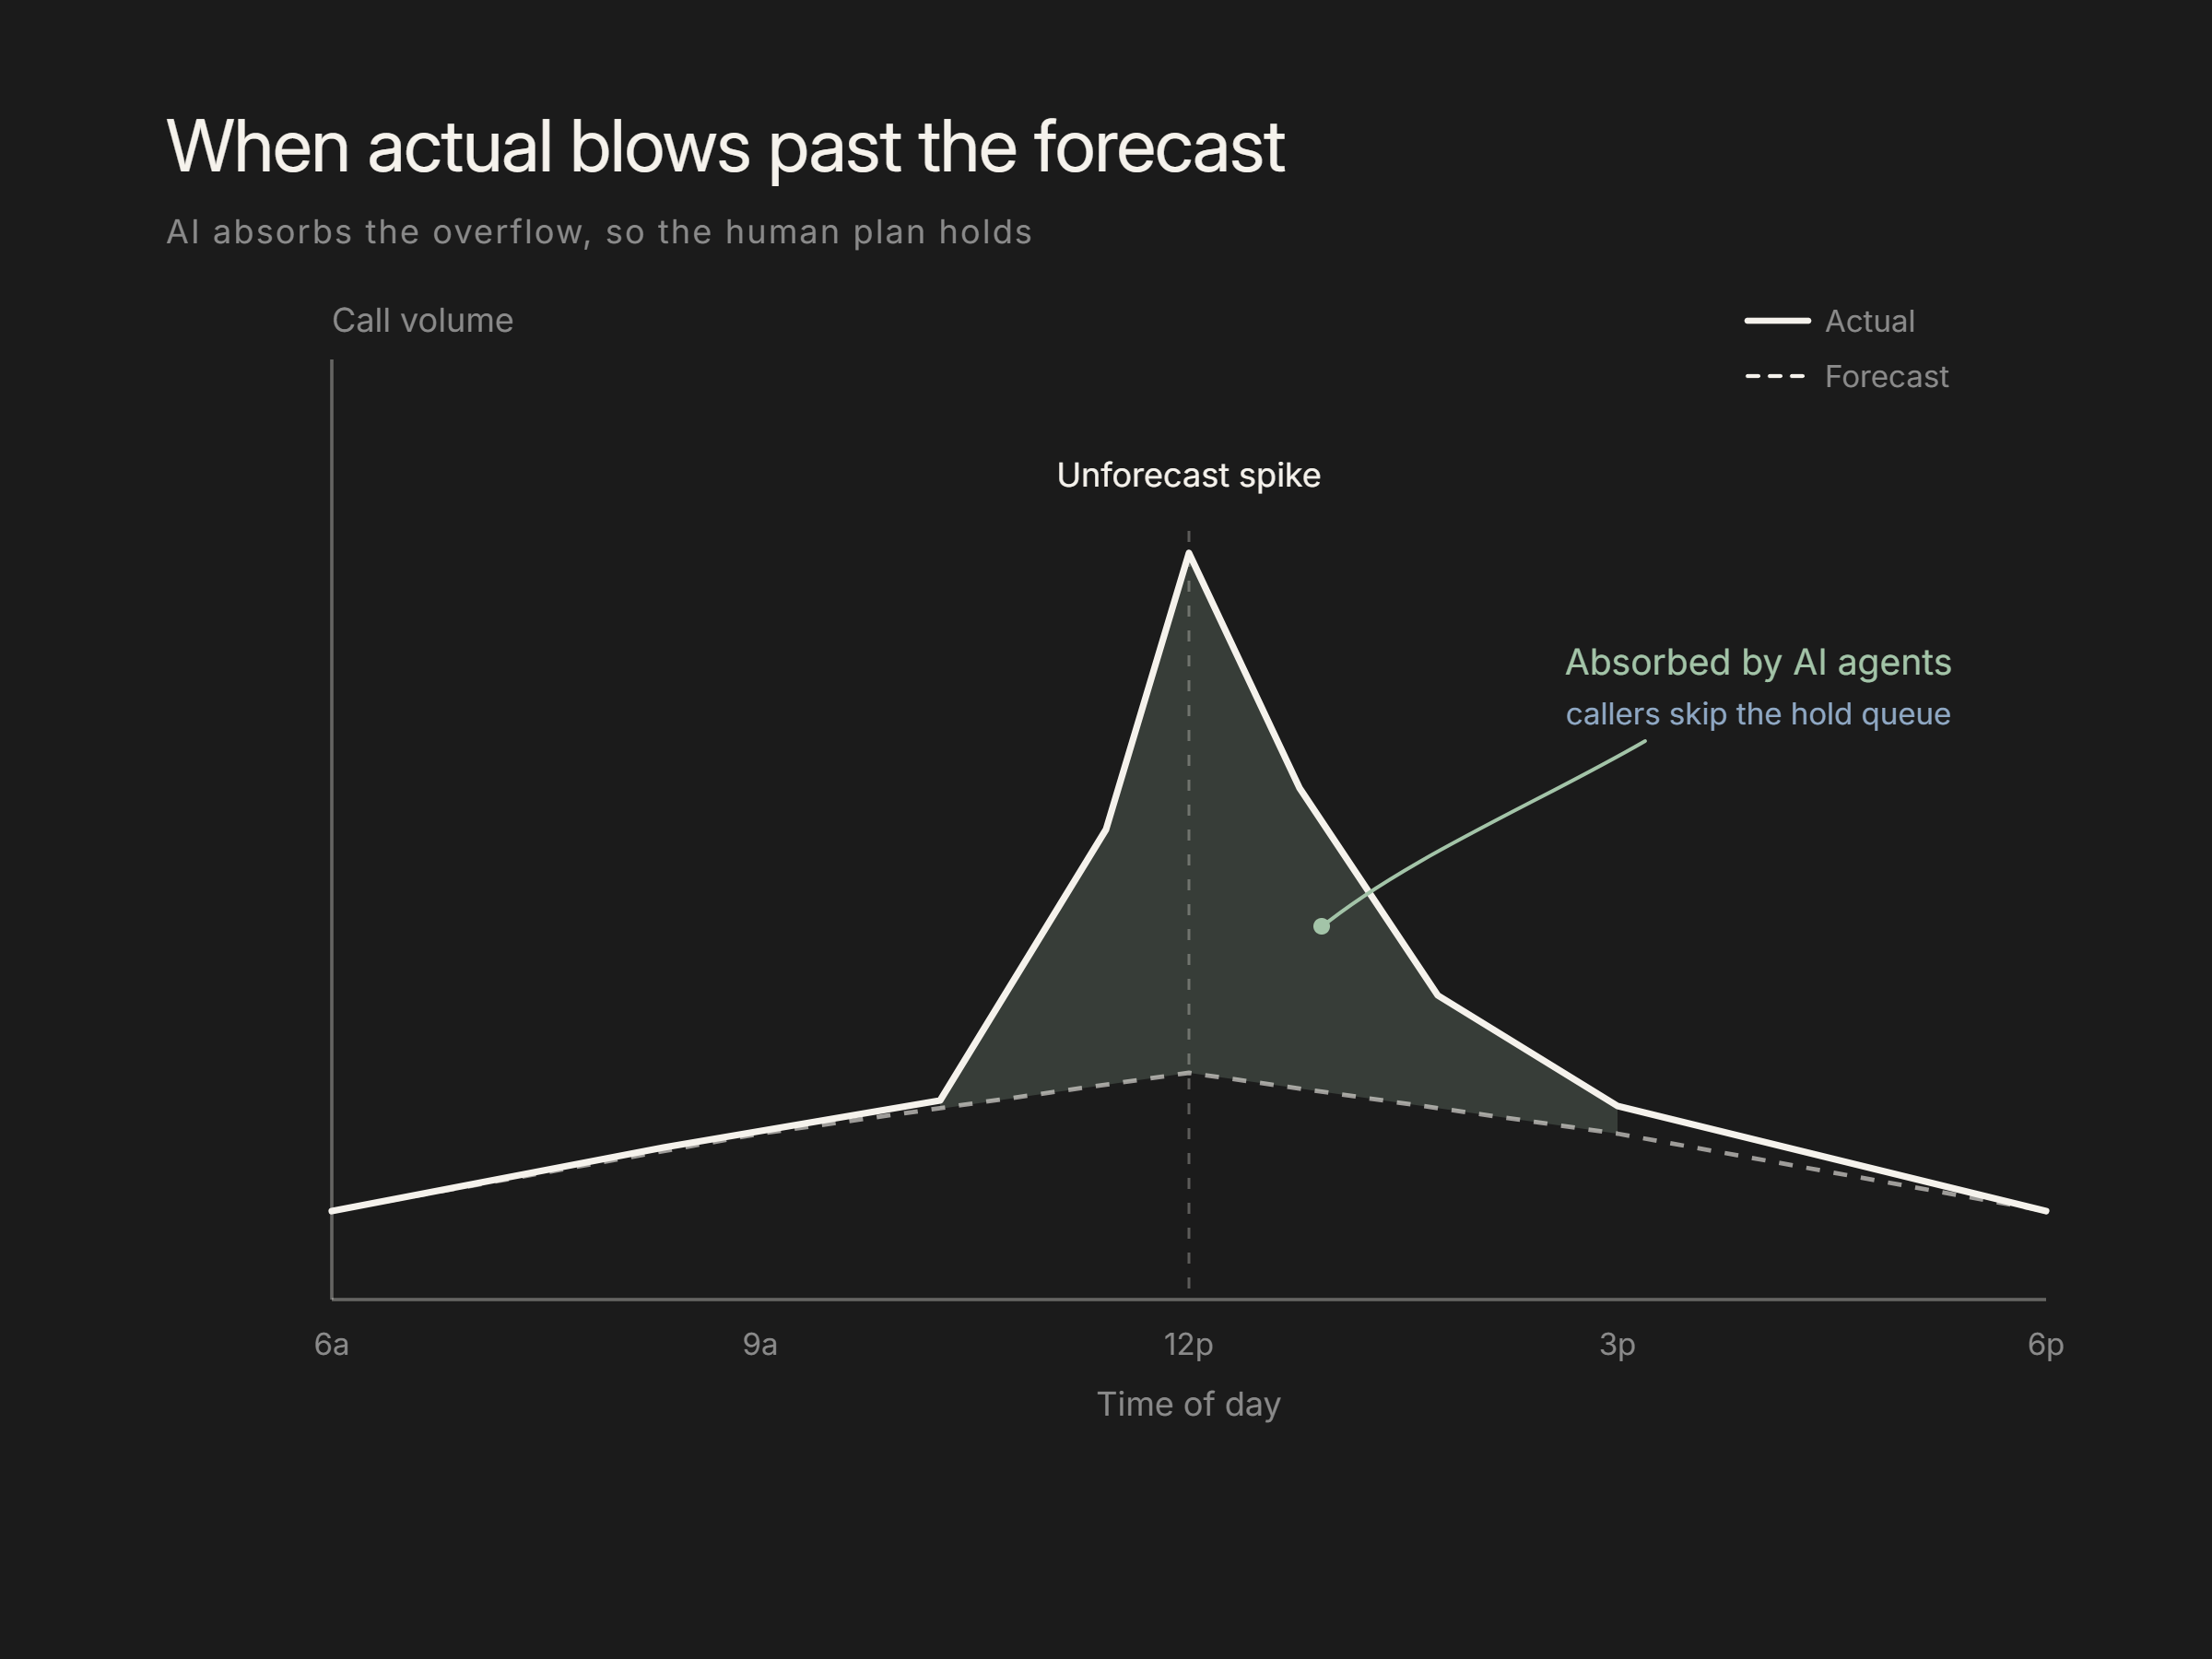
A forecast miss only hurts if every extra contact has to reach a human. Flexbone builds AI agents (voice, browser, document, and desktop) that handle routine contact-center and back-office work in secure, regulated settings, so peak spillover has somewhere to go besides the hold queue. Across BPO, insurance, healthcare, and public-sector operations, our agents answer immediately and resolve the predictable, high-volume intents that dominate a spike, which lowers the cost of an underforecast. Because we audit your interaction data first, we automate the specific intents most likely to surge, rather than a generic menu. To see how AI can absorb your peak volume, book a demo at flexbone.ai/contact.